Recently I thought i’d re-do all of my ELK stack setup, as i didnt fully understand every facet of it and i was really interested in introducing Redis into the mix. I’ve also messed around with the existing Kibana and Logstash front-end to the point it was fairly bricked, so it was ripe for a change.
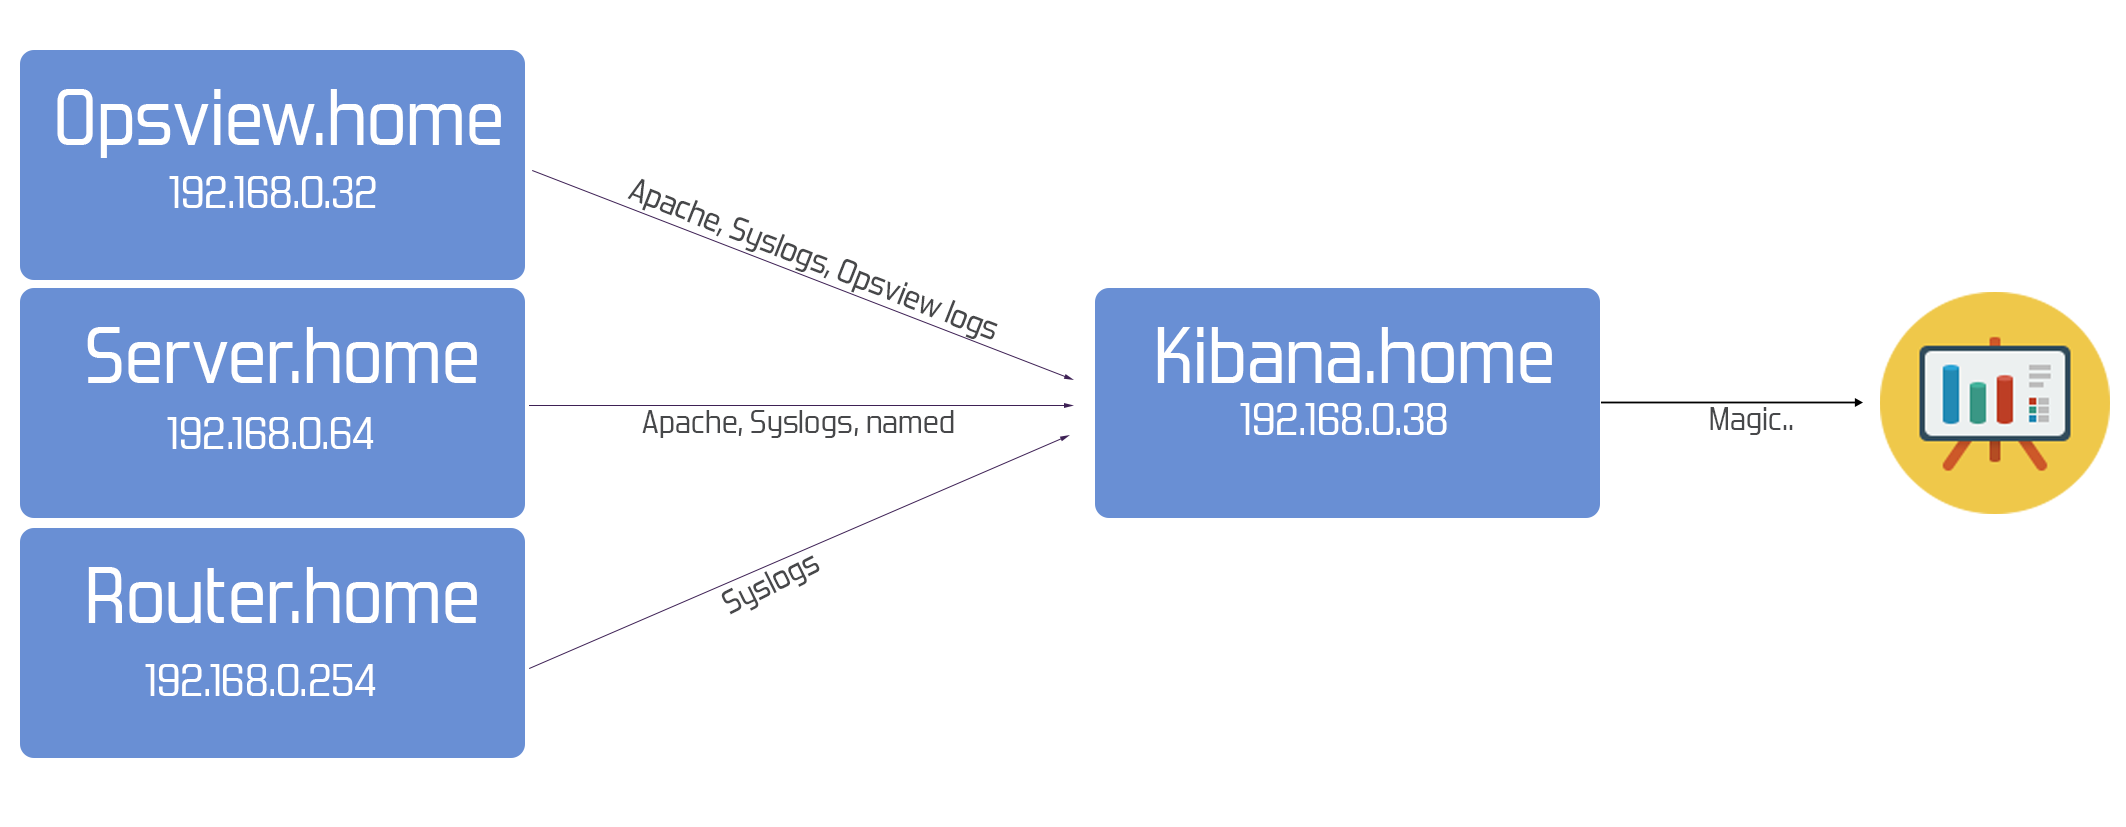
What I wanted to get to, was having my 2 servers and my main router having their logs and syslog data sent into my log box so I could view and correlate across multiple systems. Heres a pretty diagram to explain what i wanted:

To achieve this setup I used a stack of Redis, Elasticsearch, Logstash and Kibana. I used logstash forwarders on my servers to send the specified logs into a redis queue on my Kibana server. Once in the queue, Logstash would carve and process the logs and store them within Elasticsearch, from where Kibana would give me a nice front end to analyze the data. Simple right?

1. Redis
First, lets install Redis on our log monitoring server (Kibana.home, from herein). You can run all of the constituent parts of this setup on different boxes, just modify the IP’s/hostnames in the config files and remember to open up firewall ports if need be. On my small scale setup, running all of the parts on one VM was simply enough
To install redis, do the following:
root@kibana:/home/sam# wget http://download.redis.io/releases/redis-2.6.16.tar.gz
root@kibana:/home/sam# tar xzf redis-2.6.16.tar.gz
root@kibana:/home/sam# cd redis-2.6.16
root@kibana:/home/sam# make MALLOC=libc
root@kibana:/home/sam# sudo cp src/redis-server /usr/local/bin/
root@kibana:/home/sam# sudo cp src/redis-cli /usr/local/bin/
You may need to install gcc / make (apt-get install make gcc) if your system doesnt have them. At this point it would be prudent to have 2 terminals (split vertically in iTerm or similar). Next, copy the redis.conf file from the extracted packages to the same location as the binary, i.e:
root@kibana:/home/sam# cp /home/sam/redis-2.6.16/redis.conf /usr/local/bin
Open this file and modify it, if you wish to change the IP address its bound to, port, etc. Next, you need to startup redis using the command:
root@kibana:/home/sam# sudo redis-server /usr/local/bin/redis.conf
In a seperate window, run:
root@kibana:/home/sam# redis-cli ping
You should get a ‘pong’ reply, which tells you that redis is up and running. Finally, daemonize redis so that is set to run even when you kill the terminal. Open up /usr/local/bin/redis.conf and set ‘daemonize yes’, then restart redis.
2. Logstash forwarders
Next, on the client servers (devices we went to send logs FROM), run the following.
root@server:/home/sam# sudo mkdir /opt/logstash /etc/logstash
root@server:/home/sam# sudo cd /opt/logstash
root@server:/home/sam# sudo wget https://download.elasticsearch.org/logstash/logstash/logstash-1.2.2-flatjar.jar
Create your logstash config file (where you will set WHAT is exported) in /etc/logstash/logstash-test.conf and put the following in it:
input { stdin { } }
output { stdout { codec => rubydebug } }
Basically, we are going to take whatever we type in the console, and output it to the screen to test logstash is indeed working:
root@server:/home/sam# java -Xmx256m -jar logstash-1.2.2-flatjar.jar agent -f logstash-test.conf
hi hi hi
{
  "message" => "hi hi hi",
  "@timestamp" => "2014-12-11T13:35:21.121Z",
  "@version" => "1",
  "host" => "server"
}
As you can see, whatever we have typed (hi hi hi) is spat back out in a formatted fashion. So, that shows logstash is working (in a very limited way at least). Next, we need to test that logstash on this server can send data into our kibana.home server’s redis queue. To do this, create another config file in /etc/logstash called logstash-redis-test.conf, and in it add the following (obviously change my IP to the IP of your redis server!):
input { stdin { } }
output {
  stdout { codec => rubydebug }
  redis { host => "192.168.0.38" data_type => "list" key => "logstash" }
}
Next, start up logstash with this new config file (you may need to do ‘ps aux | grep java’ and then ‘kill -9 pid-of-the-java-instance‘), using the command:
root@server:/home/sam# java -Xmx256m -jar logstash-1.2.2-flatjar.jar agent -f logstash-redis-test.conf
Now, whatever we type should not only be spat back to us on the screen in a formatted fashion but should also appear in the redis-queue. So, on your 2nd terminal that is on the CLI of kibana.home (your server running redis), connect to redis so we can watch whats coming in:
root@kibana:/home/sam# redis-cli
redis 127.0.0.1:6379>
Now, back to server.home – lets generate some traffic! Type some random rubbish in and hit enter:
root@server:/home/sam# java -Xmx256m -jar logstash-1.2.2-flatjar.jar agent -f logstash-redis-test.conf
hi hi hi
{
  "message" => "hi hi hi",
  "@timestamp" => "2014-12-11T13:36:31.121Z",
  "@version" => "1",
  "host" => "server"
}
On our kibana.home console, run the following 2 command – ‘LPOP logstash’ and ‘LLEN logstash’; the latter will tell you how many items are in the queue currently and the former will pop an item off the top of the queue / stack and display it to you, as below:
redis 127.0.0.1:6379> LLEN logstash
(integer 1)
redis 127.0.0.1:6379> LPOP logstash
"{\"message\":\"hi hi hi\",\"@timestamp\":\"2014-12-11T13:36:31.121Z\",\"@version\":\"1\",\"host\":\"server\"}"
This shows that our logstash-forwarder can send events straight into the redis queue on our kibana.home server. This is where we are at the moment then:

Now, lets get some real data into redis instead of our testing! Create another file called /etc/logstash/logstash-shipper.conf which will be our ‘production config file’. In my example, I want to send my Apache log and Syslogs from /var/log into the queue, therefore i have a config as follows:
input {
  file {
    path => [ "/var/log/*.log", "/var/log/messages", "/var/log/syslog" ]
    type => "syslog"
  }
  file {
    path => [ "/var/log/apache2/access.log" ]
    type => "apache-server-home"
  }
}
output {
  redis { host => "192.168.0.38" data_type => "list" key => "logstash" }
}
What you will notice, or should notice, is the ‘type’ line – this is VERY important for later on. Essentially, our redis queue will receive data and that data will be taged with a ‘type’. This type tells logstash later on, HOW to parse/process that log – i.e. which filters to apply. I’ve also got the IP address of my kibana.home in the output line; this config file essentially tells the logstash forwarder to send the 3+ log files to redis, using the type (tags) specified.
3. Elasticsearch
Now, firmly back on kibana.home, lets install Elasticsearch. This is where the log data will eventually live. To do this, install java and then download and install the Elasticsearch package (im running all of my boxes on Ubuntu):
root@kibana:/home/sam# sudo apt-get install install openjdk-7-jre-headless
root@kibana:/home/sam# wget https://download.elasticsearch.org/elasticsearch/elasticsearch/elasticsearch-1.1.1.deb
root@kibana:/home/sam# sudo dpkg -i elasticsearch-1.1.1.deb
Elasticsearch should have started after installation – to test that it is indeed running and accessible, use CURL as below:
root@kibana:/home/sam# curl -XGET http://localhost:9200
{
  "status" : 200,
  "name" : "Scarecrow",
  "version" : {
    "number" : "1.1.1",
    "build_hash" : "f1585f096d3f3985e73456debdc1a0745f512bbc",
    "build_timestamp" : "2014-04-16T14:27:12Z",
    "build_snapshot" : false,
    "lucene_version" : "4.7"
  },
  "tagline" : "You Know, for Search"
}
root@kibana:/home/sam#
We will also want to setup a ‘limit’ on the elasticsearch data, so we dont save logs for longer than we need (And thus run out of space!). To do this, we need to download and run a program called ‘curator’, via the method below:
root@kibana:/home/sam# apt-get install -y python-pip
root@kibana:/home/sam# pip install elasticsearch-curator
root@kibana:/home/sam# crontab -e
Then in crontab, add the following line:
20 0 * * * /usr/local/bin/curator delete --older-than 60
This essentially tells the curator program to delete any syslogs / data that is older than 60 days (you can make it longer / shorter depending).
Now that elasticsearch is installed, we now need to link the redis queue to it – i.e. take data off the queue (LPOP..), parse it, and store it within elasticsearch. To do this, we will use logstash.
4. Logstash indexer
To start, lets install logstash on kibana.home:
root@kibana:/home/sam# sudo cat "deb http://packages.elasticsearch.org/logstash/1.4/debian stable main" >> /etc/apt/sources.list.d/logstash.list
root@kibana:/home/sam# sudo apt-get update
root@kibana:/home/sam# sudo apt-get install logstash
root@kibana:/home/sam# /etc/init.d/logstash start
For all intents and purposes, you can ignore logstash-web, just ensure that logstash is running (the daemon). Next, lets create the config file which this logstash instance will be using, at /etc/logstash/conf.d/logstash-indexer.conf:
input {
  file {
    type => "syslog"
    path => [ "/var/log/auth.log", "/var/log/messages", "/var/log/syslog" ]
  }
  tcp {
    port => "5145"
    type => "syslog-network"
  }
  udp {
    port => "5145"
    type => "syslog-network"
  }
  redis {
    host => "127.0.0.1"
    data_type => "list"
    key => "logstash"
    codec => json
  }
}
output {
  elasticsearch { bind_host => "127.0.0.1" }
}
Here we have a few things going on. we have an input section, and an output section – similar to the previous configurations. In this input section, we are taking 3 syslog files and tagging them with ‘syslog’, we are specifying port 5145 for udp/tcp to receive ‘syslog-network’ type data on, and we are also taking data from our redis-queue as an input also. We are then outputting this data into elasticsearch to be stored. Simple right?
The best way to do this is to use setfacl/getfacl. You will need to install the package ‘acl’ to do this, and then run a command similar to:
setfacl -R -m u:logstash:r-x /var/log/
You can test this quickly by editing /etc/passwd and giving the logstash user a shell, and then trying to ‘cd /var/log’. If it works, then logstash will be able to see these logs – if not, your setfacl command was wrong!
Now, back to that big config file. What you’ll notice is that we dont have here are any filters – we arent acting on the ‘type’ parameters we specified. The beauty of logstash is you can seperate your config out into seperate files – so instead of one god-awful long configuration file, you can have multiple little ones:
root@kibana:/etc/logstash/conf.d# ls -la
total 28
drwxrwxr-x 2 root root 4096 Dec 12 10:57 .
drwxrwxr-x 3 root root 4096 Aug 25 14:47 ..
-rw-r--r-- 1 root root  222 Dec 11 16:06 apache-filter.conf
-rw-r--r-- 1 root root  398 Dec 12 10:56 logstash-indexer.conf
-rw-r--r-- 1 root root  114 Dec 11 17:50 opsview-filter.conf
-rw-r--r-- 1 root root  710 Dec 11 14:04 syslog-filter.conf
-rw-r--r-- 1 root root  378 Dec 12 12:57 syslog-network-filter.conf
root@kibana:/etc/logstash/conf.d#
Here i have files for parsing different ‘types’ of traffic, for example anything that gets sent in with the type ‘syslog-network’ (i.e. logs from my draytek router), are pushed through rules in this config file:
root@kibana:/etc/logstash/conf.d# cat syslog-network-filter.conf
filter {
if [type] == "syslog-network" {
    grok {
      match => { "message" => "%{SYSLOGTIMESTAMP:syslog_timestamp}%{GREEDYDATA:syslog_message}" }
      add_field => [ "received_at", "%{@timestamp}" ]
      add_field => [ "received_from", "%{host}" ]
    }
    syslog_pri { }
    date {
      match => [ "syslog_timestamp", "MMM  d HH:mm:ss", "MMM dd HH:mm:ss" ]
    }
  }
}
root@kibana:/etc/logstash/conf.d#
This takes the raw data recieved from my router, and chops it into usable fields using Grok. I have a seperate .conf file for Opsview log traffic, Syslog traffic and also Apache traffic (i will put the output of these at the bottom!).
Essentially, you are telling Logstash – “Hey, if you see a log that has this type, then prepare it for storage using this filter”.
Now we have a configuration file(s), we can restart logstash:
root@kibana:/home/sam# /etc/init.d/logstash restart
We now have logstash-forwarders sending data into redis, and logstash-indexer on kibana.home is taking that data and chomping it up and storing it in Elasticsearch, as below:

It is therefore recommend to run ‘watch /etc/init.d/logstash status’ for about 20 seconds to make sure it doesnt fall over. It is does (i.e. your missing a quote or parenthesis, etc) then tail the logstash log using:
root@kibana:/home/sam# tail -n20 /var/log/logstash/logstash.log
This will tell you generally where you are going wrong. BUT, ideally you wont have made any errors! ![]()
We can test that logstash, redis and elasticsearch are playing nicely together by running ‘LLEN logstash’ in redis-cli (as we did earlier) and seeing it at 0 or reducing, i.e. 43 dropped to 2. This means that logstash is popping from the queue, parsing it through our filters, and storing it in elasticseach. Now, all we need to do is slap a front-end on it!
5. Kibana and Nginx
root@kibana:/home/sam# apt-get install git
root@kibana:/home/sam# cd /var/www
root@kibana:/home/sam# git clone https://github.com/elasticsearch/kibana.git kibana3
As i’m running nginx as my front-end, I used a config file i found which worked a treat. Put this config file at /etc/nginx/sites-available:
# In this setup, we are password protecting the saving of dashboards. You may
# wish to extend the password protection to all paths.
#
# Even though these paths are being called as the result of an ajax request, the
# browser will prompt for a username/password on the first request
#
# If you use this, you'll want to point config.js at http://FQDN:80/ instead of
# http://FQDN:9200
#
server {
  listen                *:80 ;

  server_name           localhost;
  access_log            /var/log/nginx/kibana.myhost.org.access.log;

  location / {
    root  /var/www/kibana3;
    index  index.html  index.htm;
  }

  location ~ ^/_aliases$ {
    proxy_pass http://127.0.0.1:9200;
    proxy_read_timeout 90;
  }
  location ~ ^/.*/_aliases$ {
    proxy_pass http://127.0.0.1:9200;
    proxy_read_timeout 90;
  }
  location ~ ^/_nodes$ {
    proxy_pass http://127.0.0.1:9200;
    proxy_read_timeout 90;
  }
  location ~ ^/.*/_search$ {
    proxy_pass http://127.0.0.1:9200;
    proxy_read_timeout 90;
  }
  location ~ ^/.*/_mapping {
    proxy_pass http://127.0.0.1:9200;
    proxy_read_timeout 90;
  }

  # Password protected end points
  location ~ ^/kibana-int/dashboard/.*$ {
    proxy_pass http://127.0.0.1:9200;
    proxy_read_timeout 90;
    limit_except GET {
      proxy_pass http://127.0.0.1:9200;
      auth_basic "Restricted";
      auth_basic_user_file /etc/nginx/conf.d/kibana.myhost.org.htpasswd;
    }
  }
  location ~ ^/kibana-int/temp.*$ {
    proxy_pass http://127.0.0.1:9200;
    proxy_read_timeout 90;
    limit_except GET {
      proxy_pass http://127.0.0.1:9200;
      auth_basic "Restricted";
      auth_basic_user_file /etc/nginx/conf.d/kibana.myhost.org.htpasswd;
    }
  }
}
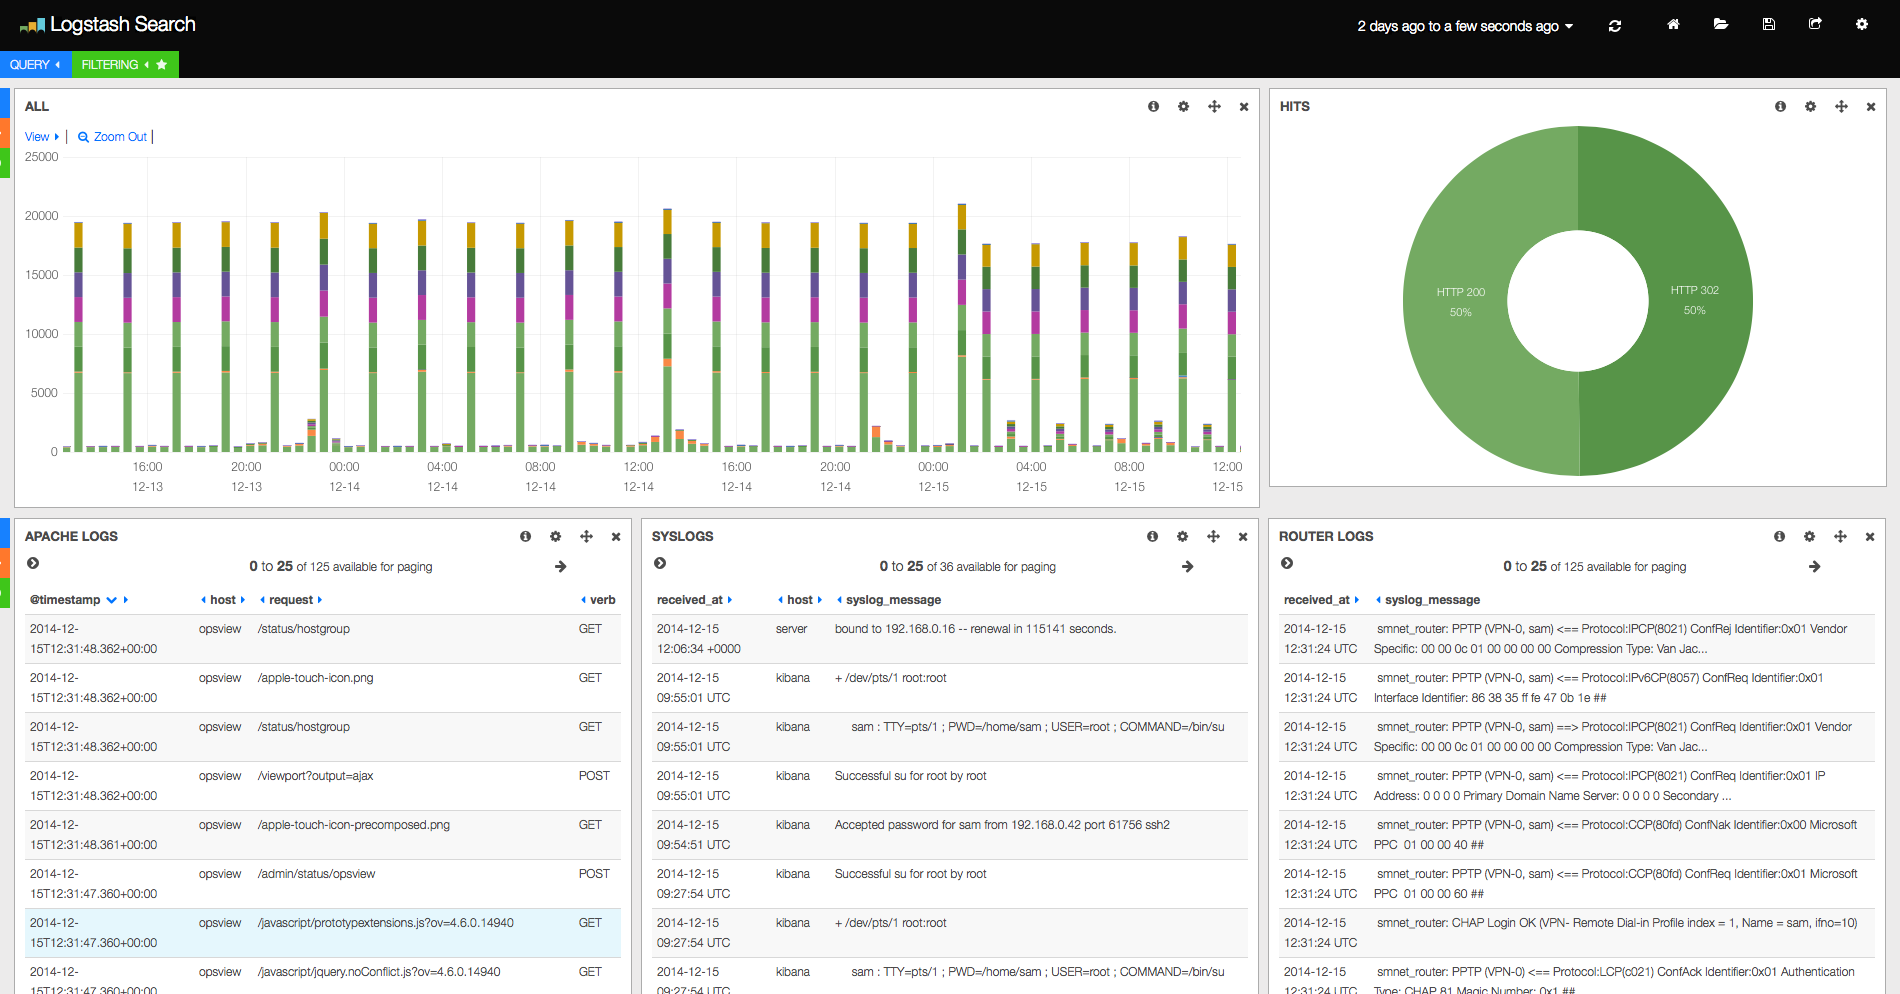
This helps get around the problems with elasticsearch being exposed outside of 127.0.0.1, etc. Now, hit up ‘http://kibana.home/’ (the address/IP of your log server, obviously!) and you should see Kibana! Here is an example dashboard i have built using the apache logs, router logs, Opsview logs and a few others:

6. Wash-up and notes
So there you have it; logs being sent via logstash-forwarder’s into a central redis queue, which is watched and processed by a logstash-indexer and stored in elasticsearch – where it is interpreted using Kibana running on nginx. The following places are the items to mentally bookmark for your fingers:
On the Kibana/Elasticsearch/Logstash/Redis server:
- Logstash directory (where all your configs are): /etc/logstash/conf.d/
- Redis: /usr/local/bin/redis.conf
- Elasticsearch: /etc/elasticsearch/elasticsearch.yml
- Kibana: /var/www/kibana3
On the servers you are sending logs from:
- Logstash: /etc/logstash/logstash-shipper.conf
One final hint / tip – To have named log all of its requests to syslog, run the command:
rndc querylog
Grok filters
Apache logs filter:
filter {
if [type] == "apache" {
 grok {
        match => [ "message", "%{URIHOST} %{COMBINEDAPACHELOG}" ] }
      }
else if [type] == "apache-server-home" {
grok {
        match => [ "message", "%{COMMONAPACHELOG} %{QS}" ] }
     }
}
Draytek router logs filter:
filter {
if [type] == "syslog-network" {
    grok {
      match => { "message" => "%{SYSLOGTIMESTAMP:syslog_timestamp}%{GREEDYDATA:syslog_message}" }
      add_field => [ "received_at", "%{@timestamp}" ]
      add_field => [ "received_from", "%{host}" ]
    }
    syslog_pri { }
    date {
      match => [ "syslog_timestamp", "MMM  d HH:mm:ss", "MMM dd HH:mm:ss" ]
    }
  }
}
Opsview filter:
filter {
if [type] == "opsview" {
 grok {
        match => [ "message", "%{URIHOST} %{COMBINEDAPACHELOG}" ] }
      }
}
Syslog filter:
filter {
#if [type] == "syslog" and [path] =~ "/var/log/dpkg.log" {
#      grok {
#        match => [ "message", "%{WORD:facility}.%{WORD:priority} %{HOSTNAME:hostname} id=%{WORD:class} time='%{TIMESTAMP_ISO8601:time$
#      }
if [type] == "syslog" {
    grok {
      match => { "message" => "%{SYSLOGTIMESTAMP:syslog_timestamp} %{SYSLOGHOST:syslog_hostname} %{DATA:syslog_program}(?:\[%{POSINT:s$
      add_field => [ "received_at", "%{@timestamp}" ]
      add_field => [ "received_from", "%{host}" ]
    }
    syslog_pri { }
    date {
      match => [ "syslog_timestamp", "MMM  d HH:mm:ss", "MMM dd HH:mm:ss" ]
    }
  }
}

