A typical word that comes up in discussion with enterprise is availability – what does this actually mean though?
Availability is basically – for how many hours in a day, weeks in a year, etc was my IT operational functional i.e. My website was accessible and people could buy products from it for 99.5% of the year – with the other 0.5% accounted for by outages, downtime planned, etc.
In IT, we talk about SLA’s – Service Level Agreements. This is where a vendor (hosting company, cloud provider, managed service provider etc) agrees with the customer as part of the contract what the availability of that service will be. In essence, the more nines, the money you’ll pay – for example, a 97.5% SLA may cost you £100 a year (arbitrary figure), whereas a 99.999% (“five nines”) SLA could cost you upwards of £100,000 a year – as five nines essentially says:
For 5.26 minutes per year or less, there will be an interruption of service.
An MSP agreeing to a 99.999% SLA, and thus tying themselves into providing a service so resilient it will be impacted less than 5 minutes will require a large chunk of your change to offset this risk.
Either way, we need to monitor our availability. In Opsview, we can use SLA reports for intervals including Daily, Weekly, Monthly, and yearly – and these will be emailed automatically etc to you or the customer, showing the SLA of that service for that time period.
However – thats a bit boring and easy to do – its all GUI driven and anyone can do it.
What I want to do is look at something a bit cooler, and something not ‘out of the box’ (what i do best).
What i’ve found is that we ship with a plugin called check_odw_hostgroup_availability. We can use this to monitor the availability of a specific host group – where a host group is a “group of hosts” (pretty obvious!) – essential, grouping together all of your “Linux Servers” i.e. LinuxServer001, LinuxServer002, etc into a group called “Linux Servers” as below:
Host Groups

And we can click onto the Host group to see the health of the hosts, then click into the host and view the health of the service checks.
Hosts

Host Information

NOTE:
You need to modify the plugin check_odw_hostgroup_availability at the moment (this fix will be commited in time for the next version of Enterprise/Pro). Change the lines at 72/73 from:
my $threshold = $np->set_thresholds(
warning => $np->opts->warning
critical => $np->opts->critical
to
my $threshold = $np->set_thresholds(
warning => $np->opts->warning.":100",
critical => $np->opts->critical.":100"
This adds the range function to the warning / critical checks – otherwise the plugin seems to worse inversely which is bizarre!
Example:
In our example, i want to monitor the host group “Linux Servers” (This could be anything, a host group called “Tonys Tyres” who is a customer of ours, etc etc).
To do this, i need to first create a service check called “HG Availability – Linux Servers” as below (image snipped so it isnt too big):

After creating our check – i’m going to add it, along with a few others for different host groups, to a “dummy host” called “HG-Availability-Checks” as below:

Next, reload Opsview and we should be able to see our host group’s availability statistics against our dummy host:

So – we can now see the “SLA %” of each of our hosts and their uptime over the past 7 days (It doesnt mention in the options if its possible to set it to longer – so we are looking at modifying this so we can specify a number of days).Quick look at the code shows:
my $end_time =
DateTime->now->subtract( hours => 1 )->strftime( "%F %H:00:00" );
my $start_time = DateTime->now->subtract(
days => 7,
hours => 1
)->strftime( "%F %H:00:00" );
So one imagines you can modify the “days => ” value – adding a “–days” or something similar?
Getting funky
So now we have our metrics and we can see the health of our host groups in terms of availability, we can do some better visualisation things.
1. Use keywords:
We can use keywords to display the health of our new service checks either ‘at a glance’, i.e. if any of the checks in the keyword are critical, then the keyword itself goes critical -or in a more detailed view:
Top level:

Detailed level:

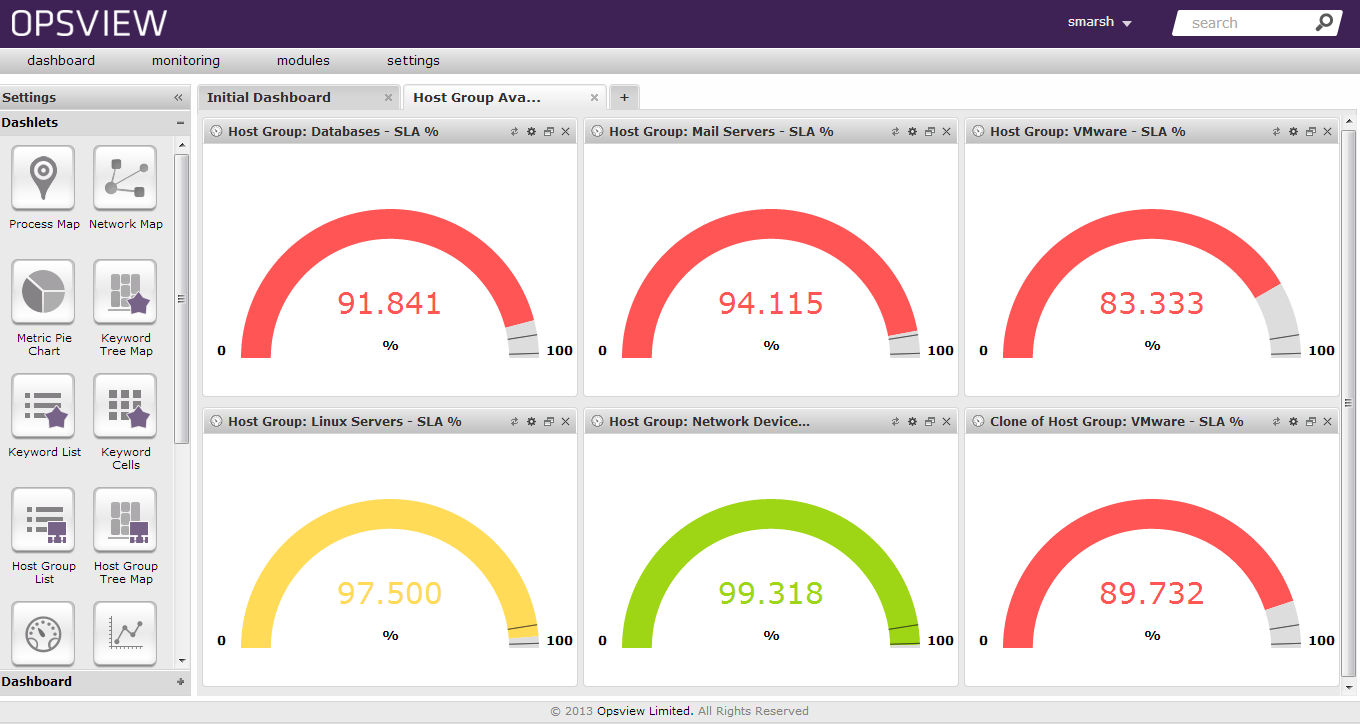
2. Dashboards
Pro or Enterprise customers can also use the dashboards to display this data. I’ve used performance gauges here to show our SLA’s for our 6 host groups:

Conclusion
So there we go – we now have the ability to not only monitor hosts, but using a little known Opsview plugin we can also monitor the SLA / availability of that host group over a given time. And because it returns performance data, we can use it for graphics, reporting, etc etc. Very nice!
Thanks
Many thanks to Harry Stevenson one of our superstar developers for fixing this issue for me!
[…] on my previous blog on SLA monitoring with Nagios / Opsview – http://www.everybodyhertz.co.uk/host-group-availability/ – which looks at measuring availability at a “group” level – where a group […]
[…] Step 4: Now we know its working, simple navigate to the Opsview GUI to create your checks – or do it via the .cfg files / command line in Nagios if thats your distro of choice, and you will now be able to monitor any WMI performance counter you desire – see “Example” and below in the link here: http://www.everybodyhertz.co.uk/host-group-availability/ […]